


From parasite biology to clinical trials
Malaria affects more than 282 million people worldwide and claims over 600,000 lives a year.
The emergence of drug-resistant parasites has complicated efforts to control and eliminate the disease, intensifying the need for new treatments that attack the malaria parasite in different ways.
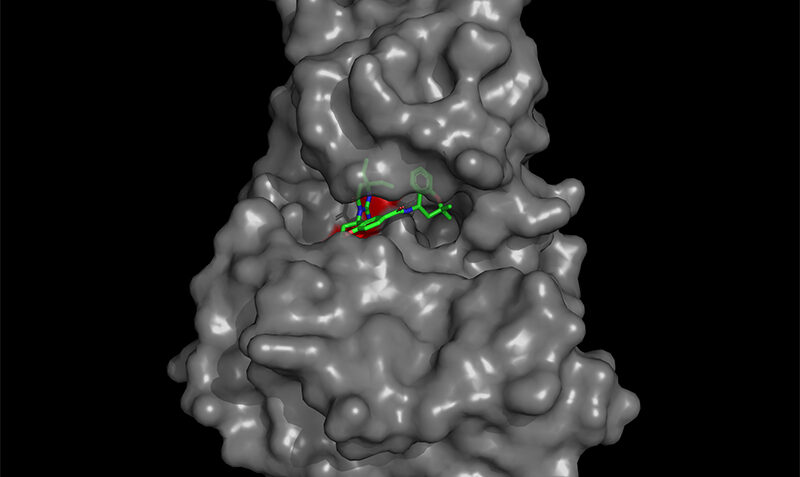
The WEHI-MSD team’s breakthrough centred on two previously unexploited proteins, plasmepsin IX (PMIX) and plasmepsin X (PMX).
In a research collaboration spanning over a decade, the team was able to uncover critical insights into how these proteins control key stages of parasite development, including red blood cell invasion, parasite replication and transmission.
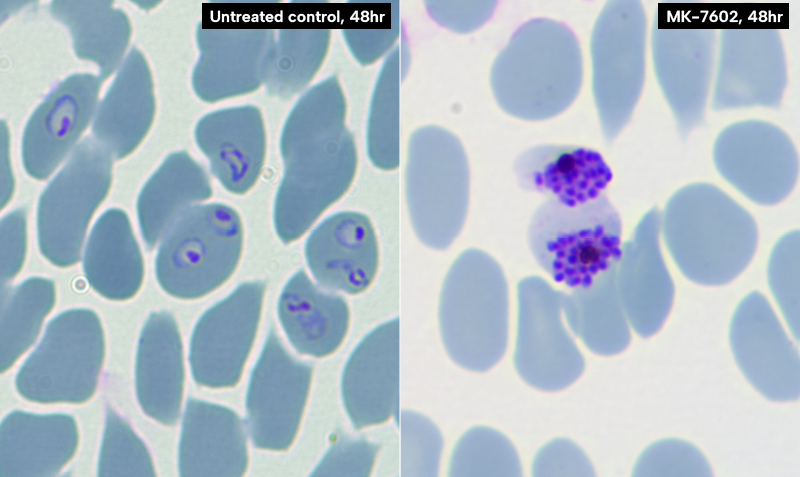
These discoveries led to the development of two antimalarial compounds capable of targeting both proteins, effectively stopping the parasite replication in its tracks and preventing further disease transmission.
Clinical trials of the team’s lead compound, MK-7602, found it can achieve blood concentration levels predicted to deliver its intended antimalarial effect – a key milestone that supports progression to later-stage clinical evaluation.